How to Use This Tool
Real-Time Data | 150+ Rivers and Sections

Search by River Basin
Has Stream Gauge?
Search by River Type
Filter by River
No Gauge Exists
No Gauge Exists
No Gauge Exists
No Gauge Exists
No Gauge Exists
Fourmile Creek of Roaring Fork River (Not Fishable) - Main Section
Colorado River Basin
No Gauge Exists
No Gauge Exists
No Gauge Exists
No Gauge Exists
No Gauge Exists
No Gauge Exists
No Gauge Exists
No Gauge Exists
Current Flows: 25 ft3/s
No Gauge Exists
Current Flows: 25 ft3/s
Current Flows: 25 ft3/s
No Gauge Exists
No Gauge Exists
Current Flows: 315 ft3/s
Current Flows: 25 ft3/s
No Gauge Exists
No Gauge Exists
No Gauge Exists
Why do fishing reports always include streamflows? Why are guides always complaining about crazy streamflow changes? Why am I asking questions that are clearing leading the topic? Because streamflows are incredibly important to the success of your day on the water when fly fishing. In this article we’re going to give a practical how to approach on how to inspect streamflows for any river that has a gauging station and use that info to plan for our day.
For anyone new to the subject, streamflows measure the rate of water moving through a stream at any given time. Scientists measure that in Cubic feet per second or CFS. The USGS and many local state agencies have 1000’s of stream gauges across the US on most major waterways to manage streamflows for agrictulture, flood control, recreation and more. As fishermen, understanding what the increase, descrease and current value of the streamflow we’re going to fish can help us a great deal in preparing our fly boxes and our expectations for the day.
Step 1 – Finding Normal
The first step in determining streamflows is to find what normal is for that time of year. 200cfs in winter on a river may be quite different than 200cfs in summer. Sure the river is flowing at the same rate, but one of those is going to be quite different from “normal” as flows are usually much lower in winter, even for tailwaters. So we want to find what is normal for that season or month and then compare that to the current value.
Almost all fishing reports will include streamflows, but the confusing part of this info is that we don’t know what the number mean in relation to the fishing. The South Platte river in Colorado can have “good” flows at 200cfs while the Bighorn river can have “good” flows at 2000cfs. If you’ve rarely or never fished these rivers and don’t know the size of the river, you have no clue what that number means.
Luckily there are two things you can do here. First is simply google the river name and get some pictures. Decide for yourself if it is a small, medium or large river. While this changes depending on where you’re from, I think a good way to think about it is as follows:
Small River/Creek: Something you can mostly always jump across or close to it. It’s also somewhere you can almost always cast where you want from any side of the river. Likely 5ft – 15ft across on average.
Medium River/Creek: Something you can commonly cast across, but it usually has two sides of the river that allow for different casts. Medium size rivers are 15 – 50 ft across in most places
Large Rivers: Anything above medium. 50ft+ across on average and typically see flows above 750+ CFS year round. You can not cast across them in most cases and you pick sides to fish.
Once you’ve determined the size of the river based on the pictures or using google maps to get a satellite view of the river, you can have an idea of what to expect for flows.
The second and more important step is to visit USGS or your local state stream gauge and check the historical data. The historical data tells you if what you’re seeing is normal, higher or lower for that time of year. This is extremely important.
If you’re using USGS, which most times will be the case, you can see a little triangle on the graph which shows the historical 10-30 yr average based on how long the streamflow gauge has readings. Typically if you’re within 10 -20% of the historical average, the river should behave as normal for that time of year in terms of streamflows and fishing. Anything higher or lower will effect the fishing in some ways which we’ll cover in a moment.
For now, log this away once you’ve found the streamflow and whether it’s normal, higher or lower than average.
Step 2 – Figure out the Seasons and The Hatches
This step may require some additional research on your spot for different rivers as hatches change from river to river. Generally speaking you get the following hatches of insect categories for each season:
- Winter – Midges and BWO mayflies for the Western US, some possible winter caddis for southern regions and little black stoneflies in late winter early spring.
- Spring – Midges, Mayflies (BWO, Hendrickson, March Browns etc), Caddis, Stoneflies (Skwala, Little Black Stones, Salmonflies some years)
- Summer – Midges, Mayflies (Green drakes, PMD/sulphurs, Pseudos, cahills, callibaetis, tricos, etc), Caddis, Stoneflies (Salmonflies, golden stones, yellow sallies)
- Fall – Midges, Mayflies (BWO, Mahogonay duns, tricos, PMDs etc), Caddis (october caddis and others), Stoneflies (occasional hatches but sporadic at best)
While this is generalized, it has some good knowledge to use as a base. Look for local hatches in your area and your rivers to narrow it down further.
Once you have seasonal and hatch info, you’re ready for the next step.
Step 3 – Figure Out Optimal Flows for the River
Determining optimal flows is important and while local knowledge (guides and fly shops) can help a lot in helping you understand what “good” flows are, the historical data found in the first step can be used again. Look at this graph from a local river here in Colorado.
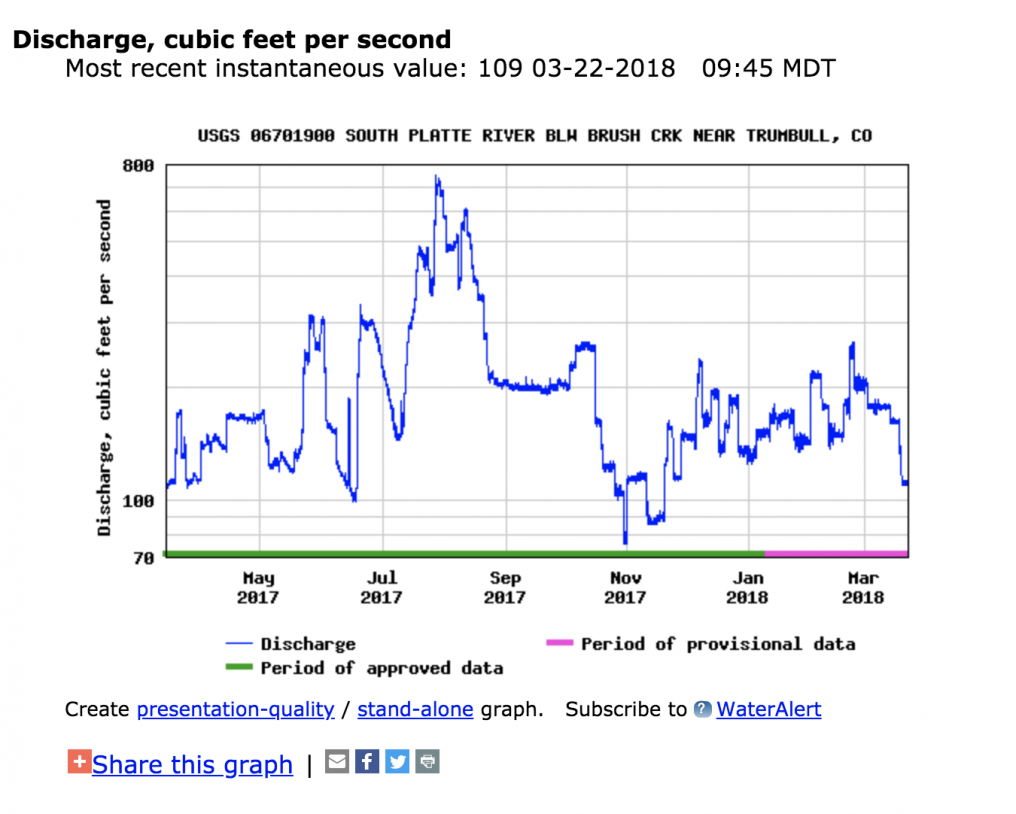
Looking at this graph we can see that through most of the year the flows range between 100 and 200 cfs. These are the optimal flows for this section of this river. You can fish it lower and fish it higher, but optimal, stable flows are normally between 100 and 200 cfs. You can use this process to figure optimal flows for any river with a stream gauge. Once you have this info, you’re now ready to put it all together and decide what kind of fishing you should expect.
Step 4 – Understanding
River Structure, Water Clarity and Water Temps
This is the last step that requires some experience and knowledge of the river. You need to have some understanding of the river structure, water clarity and water temps. A lot of these gauges have water temps which help, though not always accurate. Water temps ultimately effect insect hatches and isn’t crucially important if you are not trying to hit a specific hatch. Water clarity affects visibility for trout and if they are used to clear water, it can be hard for them to see flies in murkier water. If it is often off color, then the fish usually can adapt well and figure things out just fine. Google maps can help you see typical water clarity sometimes, but asking a local is your best bet.
That leaves us with understanding river structure. Rivers handle high and low water flows differently. If a river runs through a deep canyon with little room to expand in high water conditions, it will not perform as well in high water. If there are lots of braided channels, and room for the water to expand, it can fish well in high water as long as water clarity persists. Adversely, a river without much structure in the water to create pools and pockets for trout can struggle in low flows. Some of this can be seen on google maps if you look at the topography layer to see elevation lines and satellite views to see rocks and other visible structure in the river. There is no “perfect” scenario though and it depends per river on how flows create fishable water or challenging solutions. Once you understand the river structure for the river you want to fish, you’ll see how flows change the shape and holding locations for trout. Certain flows make for great dry fly fishing because it creates the right areas of water that fish move into and eat dries. While other rivers when flows get lower create big, slow holes that trout will bunch up in making it easier to find and catch them with nymphs.
Spend some time learning the river by walking a lot of the river, taking pictures for you to refer back to later and after just a couple visits you’ll be able to understand what makes for good fishing based on flows and stream structure.
Step 5 – Putting it All Together
Putting it all together can sometimes be easy and sometimes be quite difficult. In general, you want the flows to be within the historical range +/- 30% while staying in the optimal range you determined.
For example, if the flows are 800cfs and are normally 775cfs for that time of year, it passes the first test, but if the optimal flows are only 100 – 200 cfs, then you’re likely in a flood or runoff situation and that can generate tough fishing. You have to use all the data together to tell the story correctly. Let’s do a couple quick examples:
As of todays date, the south platte in Deckers is at 110cfs. Historically, flows are around 130cfs. That is within 30% +/- range. When looking at the historical over a year, I can see flows stay within 100 – 200cfs, so that is in the optimal fishing range. It’s spring time here so we can expect midges and baetis to be hatching on that river and active under the water. The river is in a bit of a canyon, but there is decent room for it to expand with lots of solid rocks and stable runs, holes and riffles that stay in the same places roughly year round so it’s a pretty stable river. Given all of this data put together, we can assume flows are going to produce pretty stable fishing and should produce fishing with what is to be expected for the time of year. No crazy weather or anything recently either to make us think it would be fishing out of the normal and we can expect a normal to good day on Deckers.
Another example was from a couple years back in Byers canyon of the Upper Colorado River during May (late spring, early summer). While I was unable to find the exact flows, I was fishing in late May, typically run off and high flows in CO but it was during a drought year and flows were way lower than normal. Flows were likely around 1000 cfs when they should have been around 5000cfs. This was well outside the historical range, but was in the optimal range for other times of year making it a place that could we worth fishing. I know that this was run-off for us that year and that the salmonflies would be hatching then. Usually the canyon is dangerous to fish during late may due to the high flows and the salmonflies hatch without much pressure from anglers allowing trout to have a good time during high water. This year, though, with low flows it was safe and optimal to fish and we were able to experience an excellent salmonfly hatch catching nice fish on really, really big dry flies. Super fun. My knowledge of the historical and actual flows along with my insect knowledge helped me identify a good opportunity to fish and it really paid off with one of the best memories I’ve had in fly fishing. This examples shows how optimal flows are often more important than historicals.
One last example is back at Deckers on the South platte. Flows were 260cfs in April a couple years back. This was above the historicals for that time of year and was above the optimal range but not by far. The most alarming piece of info was the quick increase in flows due to a large rain. Though common to have these spikes in flows from rain, it triggered an idea in my head. Commonly when flows spike up it means annelids (worms), and cranefly larva get dislodged in the stream and float downriver in large numbers. This underwater “hatch” creates some great fishing where those insects exist and are active. Sure enough we had a great day fishing even though the historical and optimal flows didn’t hit their mark. The lesson here is to watch for weather changing the streamflows up or down drastically making for insect opportunities and feeding opportunities for trout.
I hope these three examples give you some clarity on how the steps and data above can be used to help understand streamflows and anticipate fishing experiences. Let’s go over a few frequently asked questions know and provide some clarity on them.
How do rapid streamflow changes effect fishing?
I almost always have bad luck fishing when flows drop drastically. Fish feel threatened with downward trending flows over a short period of time and unless it’s the end of fall going into winter where flows slow down, there is usually worse fishing when flows drop quickly.
When flows come up quickly, it can often improve fishing. As long as flows don’t get too high for the river (way above optimal or historical ranges) it can improve fishing. If flows are higher than 50% of the average and above optimal ranges and it’s happened quickly, that’s usually too much water and fish will also struggle to move around and adjust to new habitat and holding locations. While this happens, they stop feeding for the most part until things have stabilized or dropped.
Do streamflow changes or levels effect insect hatches?
In short, yes. It can be a big component to triggering some hatches, while others are temperature and seasonally based. Other times, as mentioned in the example above, crane flies, or other nymphs under the water can be dislodged by increased flows making good fishing opportunities. Lower flows can cause insects to move away from the banks that are now above water. As they migrate to deeper water, fish can pick them off making for good fishing opportunities. It really helps to know more about your bugs and their behaviors in order to anticipate how streamflows will effect them in relation to fly fishing.
What are good streamflows for River (xyz)?
We already covered this, but I’ll state it quickly again. Good streamflows can be determined by historical averages and optimal flow ranges that you can get from historical streamflow graphs on USGS or whatever streamflow site you view.
How does volatility of streamflows affect fishing?
In general, the more stable the streamflows and the smaller, more gradual the adjustments, the better that is for fishing. There are certain opportunities as discussed above where quick changes create unique opportunities, but by in large, steady flows that gradually grow and decrease along with seasonality is the best. This is why tailwaters are such good fisheries for trout. Dams help regulate streamflows and if done properly for sake of trout populations can help fishing and overall trout health on the river. Stable streamflows create abundant insect life and in turn lots of food for the trout to grow big and grow fast. If there is a lot of volatility on the river graph on the report you see, you’re likely worse off than with stable flows.
How do I figure out streamflows and historical charts like you did in this article?
Visit https://waterdata.usgs.gov/nwis/rt and then in the top right, navigate to your state. Then click on the link on the right that says “Streamflow Real-Time Table” and a list of all gauges will come up. Click on the gauge you want to get the graph for today and the last several days as default. You can use this first graph to see the triangle on the graph which is the historical average. Then you can adjust the parameters in the blue box in the middle of the page. Change the “begin” date year back one year to see a years worth of data. Then use that graph to determine optimal flow ranges. Then you’re done and have historical and optimal flow ranges. Mark them down somewhere so you have it on hand for future knowledge so all you have to do is check the flows current value and you know what to do with it.
Conclusion
That about sums it up! While it can take some time to learn this stuff for all the rivers you fish, it’s highly valuable in being able to understand how the fishing should be based on the flows. Once you have that idea, you can look at the weather, fishing reports and more to help you decide where you should best fish. We hope you enjoyed the article and found it informative.