A hatch chart tells you what insects are probable on a given river during a given month. It does not guarantee a hatch will happen on any specific day, at any specific reach, or at any specific water temperature. Think of it like a weather forecast for insects: useful as a starting point, but never a promise. The angler who understands this distinction shows up prepared to read conditions and adjust. The angler who treats the chart as a schedule shows up expecting a show that may not start for another two weeks – or may have already ended yesterday.

Why a Hatch Chart Cannot Predict Your Day
How conditions change the timing of a hatch
A Hatch Chart Describes Probability
Every hatch chart is built from observations collected over time and averaged across conditions. What it captures is a seasonal window of probability, not a fixed event on the calendar.
The same insect can show dramatically different timing depending on where you are fishing. The Hendrickson is a good example. Across the East and Midwest, the regional window is April through May. But on a river like the Au Sable, the Hendrickson hatch and its associated subsurface activity can stretch from April all the way into October as the insect continues to be available in the water column in nymph form long after the primary emergence window closes. A chart entry for "Hendrickson – April-May" is accurate for a broad regional view, but it does not capture what a specific river is doing in any given spring.
Caddis show the same pattern. The Tan Caddis hatch on the Battenkill runs April through July. On the Animas River in Colorado, that same insect's window runs May through October. If you looked only at a regional chart and brought a Battenkill mindset to Colorado in September, you would be right on target. If you expected the Animas to behave like the Battenkill in July, you would miss the timing entirely.
The Little Black Caddis shows similar regional spread. In the East and Midwest it runs April through July. In the Southeast it compresses to March through May. In the West it shifts later to June through August. Same insect, very different windows depending on where you are standing.
This is not a flaw in the chart. It is what the chart is built to do: show you the range of probability for a region or river. The gap between "probable" and "happening right now on this reach" is where conditions come in.
What Changes Hatch Timing
The calendar sets a rough outer boundary. Conditions determine what actually happens within it.
The most important variables are river type, elevation, and current water conditions. These interact with each other, and they can push timing by days or even weeks in either direction.
River type is one of the biggest factors. A tailwater river like the South Platte below a reservoir runs consistent, cold water year-round because the reservoir buffers temperature swings. The South Platte below Eleven Mile is fishable through all four seasons, and its midge hatch runs every month of the year. Blue-Winged Olive hatches on the South Platte occur in January through April and again September through December. That schedule differs from a high-elevation freestone stream nearby. A chart entry for that river reflects a very different reality than a chart entry for a high-elevation freestone stream nearby.
A high-elevation freestone river like the Colorado River in the Kawuneeche Headwaters above Rocky Mountain National Park behaves completely differently. It runs cold snowmelt through the early season and is only reliably fishable in summer and fall. Even though the Colorado River at lower elevations might be showing active Green Drake and Golden Stone hatches in June, that same calendar date at the headwaters can still mean cold, runoff-blown water where no surface activity is happening yet.
Elevation compresses and delays the seasonal progression. What a lower Colorado River reach is seeing in late May may not arrive at a high-elevation freestone stretch until late June or even July. Any chart that shows a statewide or river-wide window is averaging across elevations. When you are fishing a specific reach, you need to know where it sits on that elevation gradient.
Current flow, temperature, and clarity are the real-time indicators. Before any trip to a Colorado freestone river, the practical step is to check current discharge and water temperature. A high-flow spring runoff year can push PMD and Mother's Day Caddis timing back significantly – the insects do not hatch on a calendar date, they hatch when water conditions allow. Clarity matters too. Dirty, turbid runoff water suppresses surface activity even when temperature and timing look right on paper.
Time of day is the other variable many anglers underestimate. Even when a hatch is occurring on a given day, the window can be narrow. Winter and early spring hatches on Colorado tailwaters often happen in the warmest hours of the afternoon when sunlight has had time to work. Summer hatches on the same rivers often shift earlier in the morning or later in the evening to avoid midday heat. If you are arriving at the water at 10am expecting a hatch that the fish know starts at 2pm, you will spend two hours wondering what the chart got wrong.
Use the Chart as a Starting Hypothesis
The right mental model is simple: the hatch chart is your pre-trip hypothesis, not your fishing plan.
Here is how to hold it correctly.
First, consult the chart before you go. Identify which insects carry the highest probability for your target river and calendar date. On the South Platte in May, for example, the chart tells you that Mother's Day Caddis are active in April and May, PMDs are coming in May through July, Summer Caddis begin in May, and midges remain active all year. That is your probability list.
Second, check current conditions before you leave. Look up the discharge gauge for your section and check recent flow trends. If flows are higher than normal due to snowmelt, the Mother's Day Caddis hatch may be pushed back, and the midge is the more reliable bet. Water temperature, when available, gives you another layer.
Third, observe when you arrive. The chart told you what to expect. The river tells you what is actually happening. Look for insects in the air, on the surface, and in the film. Check the rocks and bankside vegetation for shucks. Watch where trout are feeding and how – rising confidently to something on the surface, or showing subtle subsurface takes in the film. What you see in the first 15 minutes on the water is more current than any chart.
Fourth, adjust your fly choice to what you observe, not what the chart predicted. If the chart said PMDs but the water is cold and only midges are in the air, fish midges. The PMD nymphs are still in the river – they are just not hatching yet – but that is a different question than what you should tie on right now.
If you want to build a deeper foundation for reading these decisions – understanding what triggers a hatch, how to identify life stages, and why trout respond the way they do at different points in the cycle – the Fly Fishing Entomology Course covers all of it in a structured way that translates directly to better on-the-water decisions.
Fly Fishing Entomology
Fish With Confidence
Master the 13 key trout foods and
never guess which fly to use again
- 8 Lessons, 100+ pages
- Learn to identify any insect stage and category
- Match it to any fly in your box
- Works for any river and region trout live
- Lifetime access & coupons for over $225 in savings
- Detailed Regionalized Hatch Charts
A Worked Example From Chart to Water
Scenario: it is mid-May, and you are heading to a Colorado freestone river – a stretch of the South Platte that has been running higher than average due to a wet spring. You checked the hatch chart before you left. It shows PMDs active May through July, Mother's Day Caddis active April through May, Summer Caddis beginning in May, and midges year-round.
Your hypothesis going in: PMDs are probable, Mother's Day Caddis may still be happening, midges are always an option.
You arrive at the river and check the water. It is running on the high end of fishable, slightly off-color, and cold. You do not see any surface activity. No adults in the air, no rises. You flip a few rocks along the bank and find midge larvae and a few small caddis pupae but no PMD nymphs actively moving.
Here is what the conditions are telling you: the chart said PMDs are probable in May, and that is correct in terms of seasonal probability. But this particular stretch, at this particular flow and temperature, has not warmed enough yet to trigger PMD activity. The snowmelt is keeping the water cold, and the fish are holding low.
The midge, on the other hand, hatches year-round on this river regardless of temperature. It is the most reliable insect available right now. A Beadhead Zebra Midge fished deep near structure is the most honest read of the current situation.
If you had locked onto the PMD expectation and refused to adjust, you would spend most of the day without a fish and blame the chart. The chart was not wrong – PMDs are probable in May. The conditions just have not caught up yet. Give it two more weeks of warmer days and lower flows, and PMDs will start showing.
The lesson is not that charts are useless. The lesson is that the chart opened a door, and the conditions told you which one to walk through today.
What to Check When the Hatch Is Late or Absent
You arrive at the water during a window the chart says should be active. Nothing is happening. Here is the diagnostic sequence.
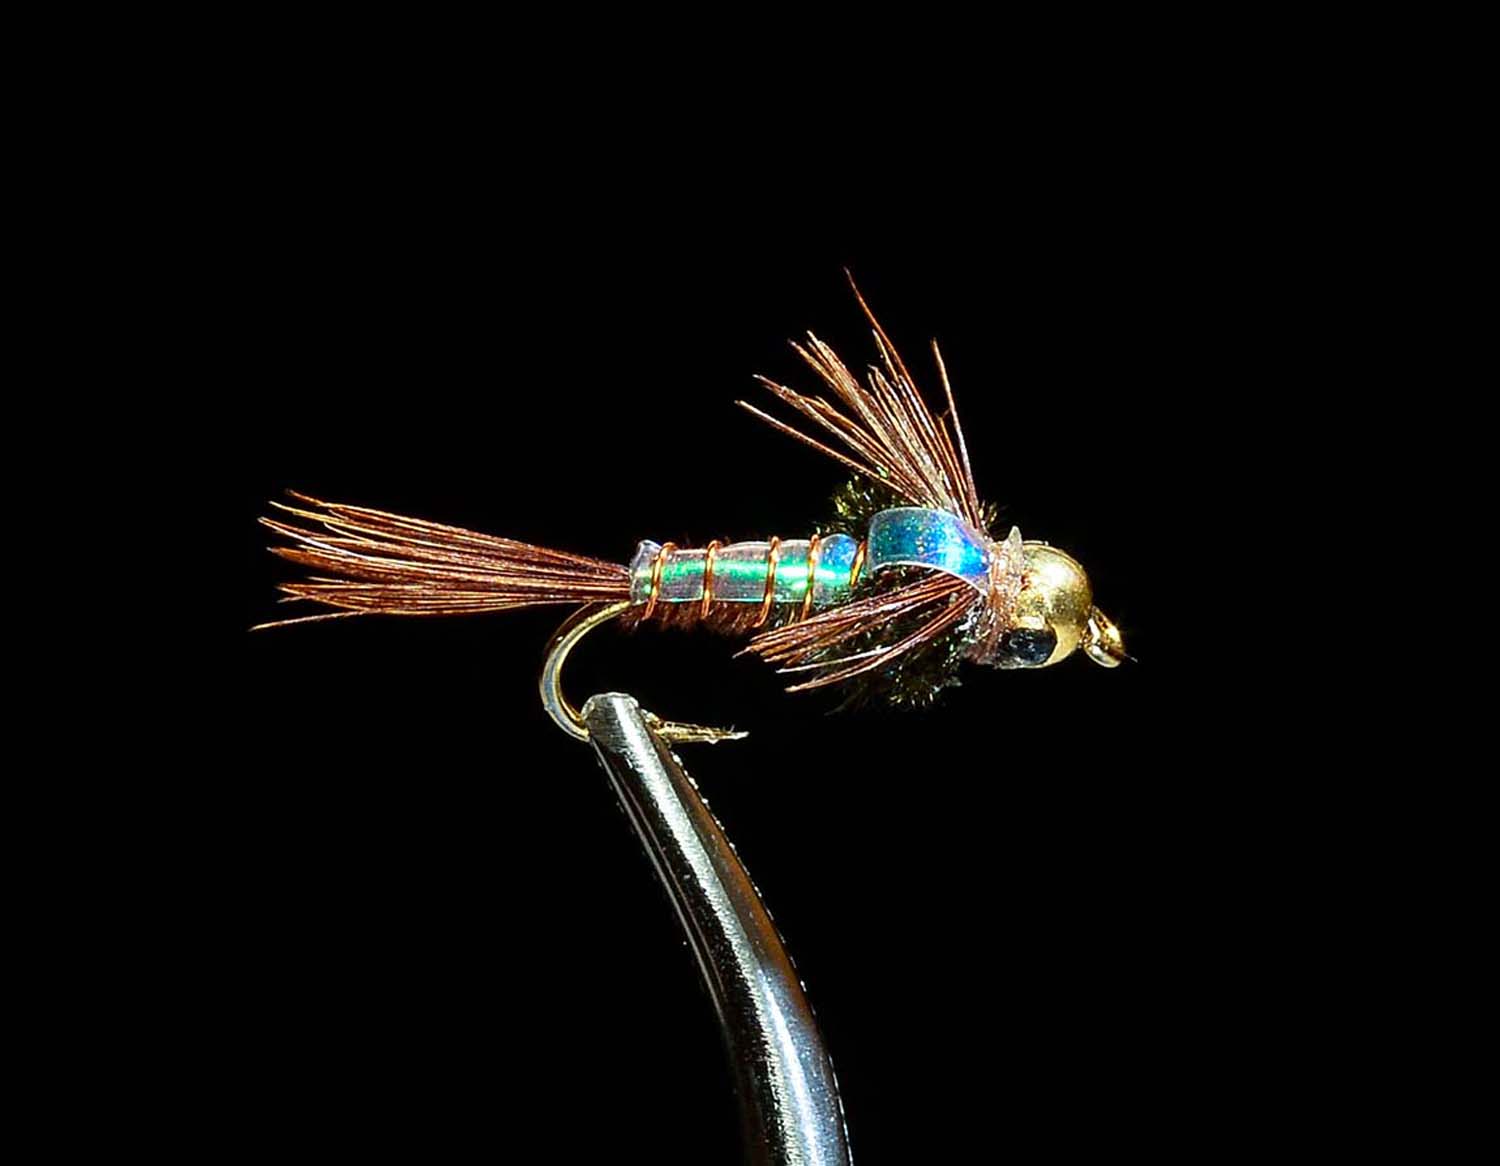
Check flow first. High flows following runoff are the most common reason a spring hatch is delayed. If the gauge shows flows well above the normal seasonal range, surface activity is likely suppressed. The insects may be present in the water column as nymphs, but they are not yet emerging at the surface. Fishing subsurface with nymphs – a Beadhead Pheasant Tail or a Copper John fished near bottom – is the honest adjustment. The food is still there; it just is not on top.
Check water clarity. Turbid or muddy water limits both the insects' ability to emerge effectively and the trout's ability to see surface targets. On high-visibility Colorado freestone rivers, clarity is a key trigger for dry-fly activity. If the water is off-color, go subsurface.
Consider the distinction between background presence and active hatch. Blue-Winged Olive nymphs, for example, are present in the water column on the Colorado River from March through October as background biology. But the BWO hatch itself is most active March through May and again September through October. Outside those windows, BWOs are in the river but not actively hatching to the surface. Stonefly nymphs on the Yampa River are similarly present subsurface from March through May and again September through November outside the main hatch window. Present in the water does not mean hatching to the surface.
This distinction matters practically. If you are in a month where the chart shows background nymph presence but not an active hatch window, fishing a nymph near bottom is often more productive than watching the surface for rises that are not coming.
Consider time of day. If you arrived early and the water is cold, wait. On many Colorado tailwaters in spring, surface activity does not begin until afternoon. On summer rivers, the opposite is true – early morning or evening gives you the best window, and midday heat shuts activity down. If you are there at the wrong time, the fish are not refusing you; they are simply waiting.
Consider whether the hatch already happened. Caddis, in particular, can condense their emergence into a very short evening window. If you arrive at midday on a river where caddis hatch heavily at dusk, the chart is accurate but your timing is off. The hatch was real – it was just done before you got there.
When none of the above explains the absence, adjust your fly choice without abandoning the chart entirely. Fish subsurface to what the chart says is present as background biology. Change depth, change presentation, check your drift. The bugs are in the river. The question is whether today's conditions are asking them to the surface.
If you want a practical fly selection organized around the trout foods and life stages that actually matter across these scenarios, the Entomology Fishing Fly Assortment covers the stages and patterns most relevant to this kind of match-the-conditions decision-making.
Recommended Reading
Once you understand that the hatch chart is a probability map rather than a schedule, the next natural questions move to what is actually happening during an active hatch. When trout are rising, knowing whether they are taking insects in the film as emergers or targeting fully winged duns on the surface changes everything about which fly you tie on. Are Trout Eating Emergers or Duns? walks through how to read that distinction.
And what happens between hatches, when no surface activity is occurring at all? That is where a lot of productive fishing time gets wasted by anglers waiting for the next event. What Do Trout Eat Between Hatches? covers what trout are actually feeding on during those quiet windows and how to approach them.